Climate change is creating volatile growing conditions and added consumer pressure to reduce GHG emissions
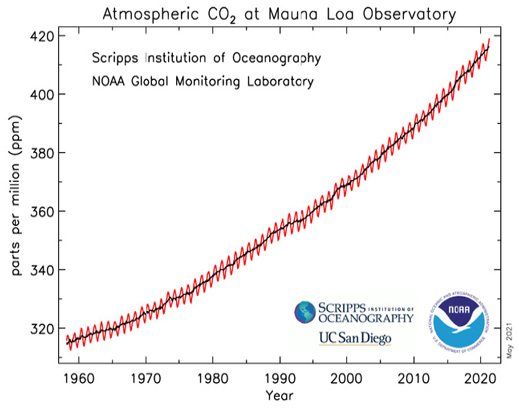
Atmospheric greenhouse gas (GHG) concentrations are rising which may contribute to more volatile weather patterns in the future bringing more frequent and intense hurricanes, prolonged periods of drought, increased incidence of flooding, and other weather extremes.Burning fossil fuels increases atmospheric concentrations of greenhouse gases like carbon dioxide (CO2), methane (CH4), and nitrous oxide (N2O). Methane and nitrous oxide emissions are even more powerful GHGs than carbon dioxide, meaning they have the potential to warm the earth more rapidly than carbon dioxide. Our research shows consumers are becoming increasingly concerned with climate change impacts, especially younger generations2.
What do we know about cotton’s greenhouse gas emissions?
The global cotton life cycle assessment shows us that nitrogen fertilizer has the biggest impact in terms of the global warming potential of cotton in the agricultural production phase3. Both the field emissions associated with the use of nitrogen fertilizer and manufacturing of nitrogen fertilizer collectively contribute 64% of the global warming potential (GWP) for cotton cultivation (Figure 2). The U.S. cotton industry has an overall downward trend in greenhouse gas emissions through time, with a 2025 goal of reducing GHG emissions by 39% (Figure 3).
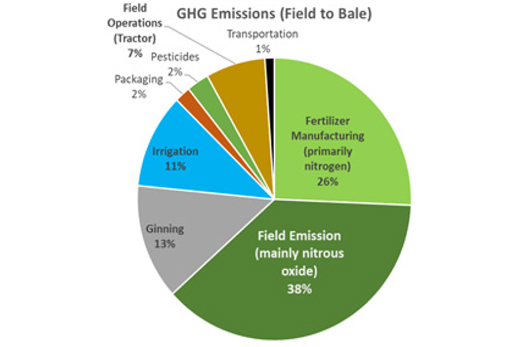
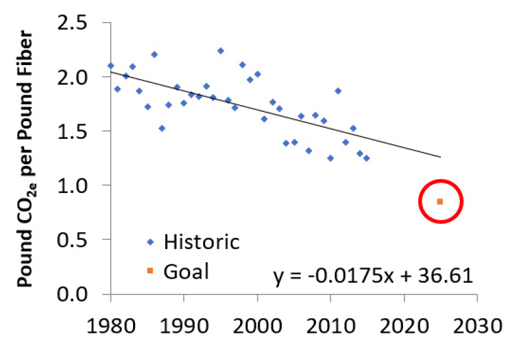
and 10-year sustainability goal.4, 5
How can we optimize nitrogen use to reduce the climate impacts in cotton cultivation?
Using the “4R concept” to fertilizer application, cotton producers ensure that only the Right fertilizer source is used, at the Right rate, at the Right time, and in the Right Place. When the “4R concept” is followed, fertilizer can be used more efficiently, which can reduce both fertilization rates and associated GHG emissions. Precision agricultural technologies are also helping growers improve their nitrogen use efficiency (Figure 4), allowing more nutrients to be absorbed by the plant with less exiting the system as GHG emissions.
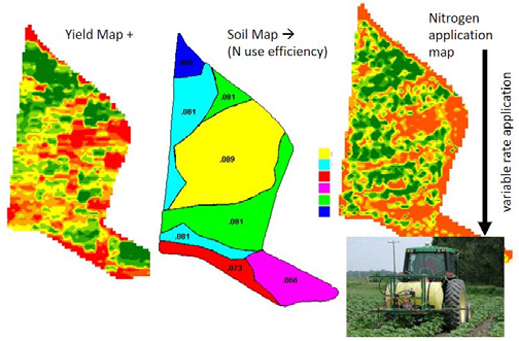
fertilization management approaches for growers (maps compliments of Dr. Gary Roberson, NC State University).
What other ways is cotton part of the solution?
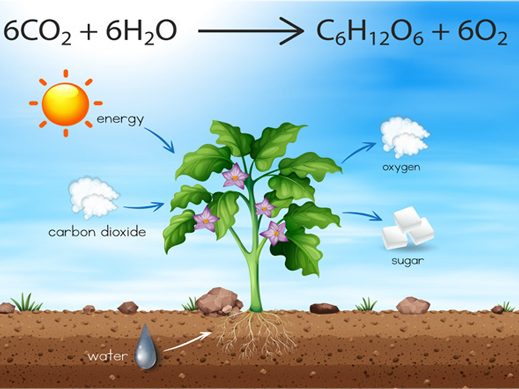
The U.S. cotton industry has set aggressive sustainability goals targeting GHGs, soil carbon, and energy use. By 2025, U.S. cotton growers have committed to decreasing greenhouse gas emissions by 39%, increasing soil carbon by 30%, and decreasing energy use by 15%.5 Additionally, cotton production naturally sequesters carbon in the soil and in the fiber itself. During the process of photosynthesis (Figure 5), the cotton plant transforms carbon dioxide and sunlight into glucose sugars. In the cotton example, some of those sugars are transformed into cellulosic fibers (i.e., cotton lint). This carbon is also stored in our clothing as we wear it. Since carbon is naturally stored in plant material, in the soil, and within the cotton lint, there is an opportunity for cotton agricultural systems to mitigate future climate impacts. But how much carbon can actually be stored in the soil and within the lint under the current system? The short answer is, quite a bit, and with increasing adoptions of best management practices in cotton production systems the sequestration rates will only continue to rise. Minimizing soil disturbance is key to keeping carbon in the ground. This is most commonly accomplished via conservation tillage implementation by cotton producers. Applying no-till practices alone can sequester as much as 450 kg of soil organic carbon per hectare per year7. To put this in perspective, in 2020 if 20% of all cotton producers globally implemented no-till practices, approximately 3.5 million metric tons of carbon could be sequestered by this practice change alone3, 7, 8. That level of emission reduction is equivalent to removing 760,000 vehicles from the road for a year9! Additionally, adding diverse crop rotations and cover crops to no-till management can boost carbon storage even higher, while providing other key benefits such as weed control to the producers as well.
For more information on cotton production methods and sustainability visit cottontoday.cottoninc.com
1: Scripps Institution of Oceanography and National Oceanic & Atmospheric Administration (2021). Global Monitoring Laboratory, Monthly Average Mauna Loa CO2. https://gml.noaa.gov/ccgg/trends/mlo.html
2: CCI & Cotton Incorporated Global Environment Survey (2017).
3: Cotton Incorporated (2017). LCA update of cotton fiber and fabric life cycle inventory, (1). Retrieved from https://cottontoday.cottoninc.com/wp-content/uploads2019/11/2016-LCA-Full-Report-Update.pdf
4: The Alliance for Sustainable Agriculture (2016). Environmental and Socioeconomic Indicators for Measuring Outcomes of On Farm Agricultural Production in the United States (Third Edition). ISBN: 978-0-692-81902-9.
5: National Cotton Council, Cotton USA, & Cotton Incorporated (2018). U.S. Cotton Ten Year Sustainability Goals: Pathways to Progress. https://www.cottoninc.com/wp-content/uploads/2018/02/Cotton_Sustainability_2018.pdf
6: Getty Images 2021
7: Franzluebbers, A. J. (2010). Achieving Soil Organic Carbon Sequestration with Conservation Agricultural Systems in the Southeastern United States. Soil Science Society of America Journal, 74(2), 347–357. https://doi.org/10.2136/sssaj2009.0079
8: Cotton Incorporated (2021). Monthly Economic Letter: Cotton Market Fundamentals & Price Outlook, February 2021.
9: United States Environmental Protection Agency (2018). Greenhouse Gas Emissions from a Typical Passenger Vehicle. https://nepis.epa.gov/Exe/ZyPDF.cgi?Dockey=P100U8YT.pdf