
Supplement to the Monthly Economic Letter
Balance sheets are a way to account for changes in cotton supply and demand estimates. To support new readers of the Monthly Economic Letter, core terminology and concepts behind balance sheets are explained below.
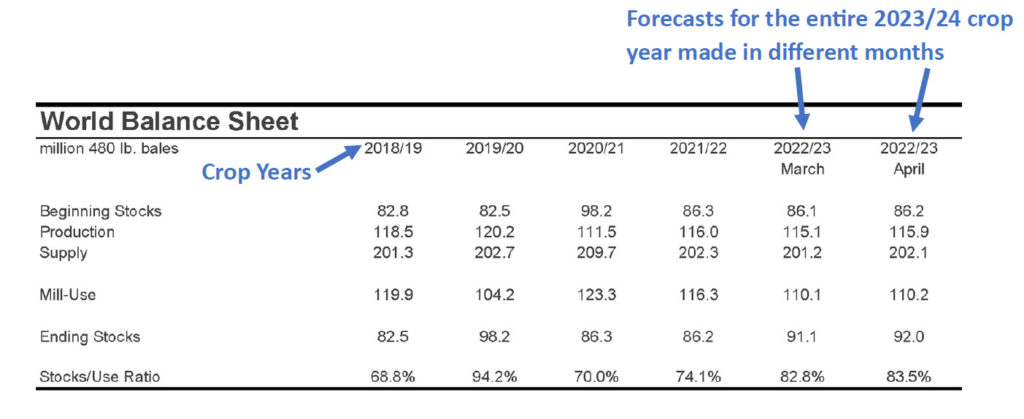
Crop Year
The crop year is the timeframe for all cotton statistics. Like fiscal years, crop years do not correspond to the January-December annual calendar.
Instead, the crop year (also known as the marketing year) can be thought of as the time to sell a given harvest before the next harvest comes in behind it. Individual countries can have different country-specific calendars for their crop years (e.g., the Indian crop year runs October-September). The international cotton crop year is based on production in the northern hemisphere, and it begins on August 1st and ends on July 31st.
All the figures presented in balance sheets in the Monthly Economic Letter are estimates for an entire crop year. The two rightmost columns, with monthly headers, highlight how forecasts for entire crop years changed with new information learned over the past month. For example, the rightmost columns in balance sheets generated in April 2023 allow the reader to compare the latest forecasts (April 2023 in this example) for the entire 2022/23 crop year (August 2022-July 2023) against forecasts for the entire 2022/23 crop year that were released in March 2023.
Stocks
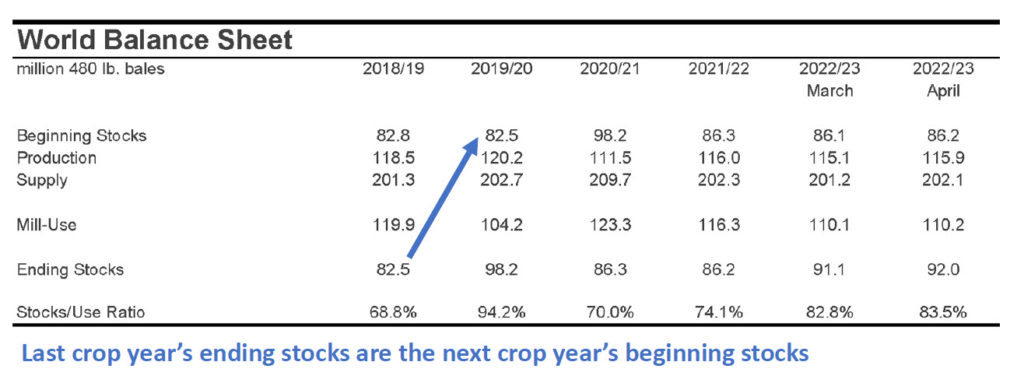
Stocks refer to the amount of cotton stored in warehouses. If kept dry and out of the elements, cotton that is several years old can still be spun into yarn.
The amount of cotton stored at the beginning of the crop year (August 1st) is referred to as beginning stocks. This volume is equal to the previous crop year’s ending stocks. Ending stocks are the amount of cotton in storage at the end of the crop year (the amount estimated to be in warehouses on July 31st).
Supply
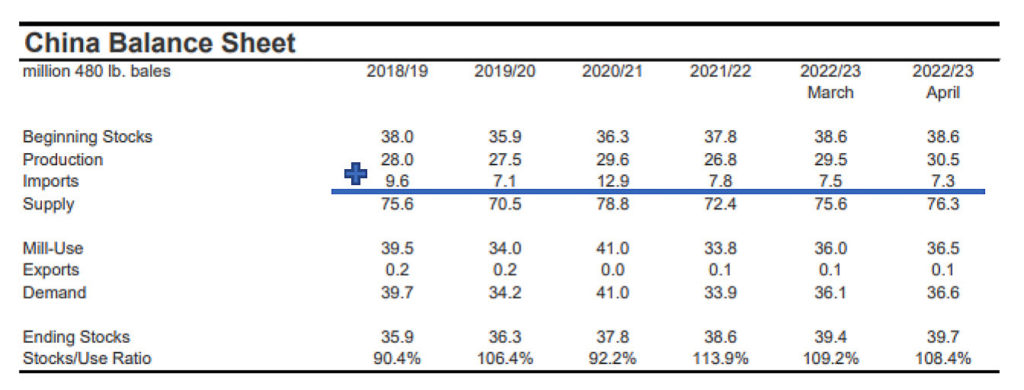
Cotton supply is the sum of cotton in storage, the amount of cotton grown, and cotton imports.
The cotton grown and harvested during this crop year is termed production.
At the global-level, imports are excluded from the equation (the world is not trading with other planets yet).
Beginning Stocks = Amount of cotton in storage at the start of the crop year (August 1st)
Production = Cotton grown and harvested in a given crop year
Imports = Cotton shipped into the country
Supply = Beginning Stocks + Production + Imports
Demand
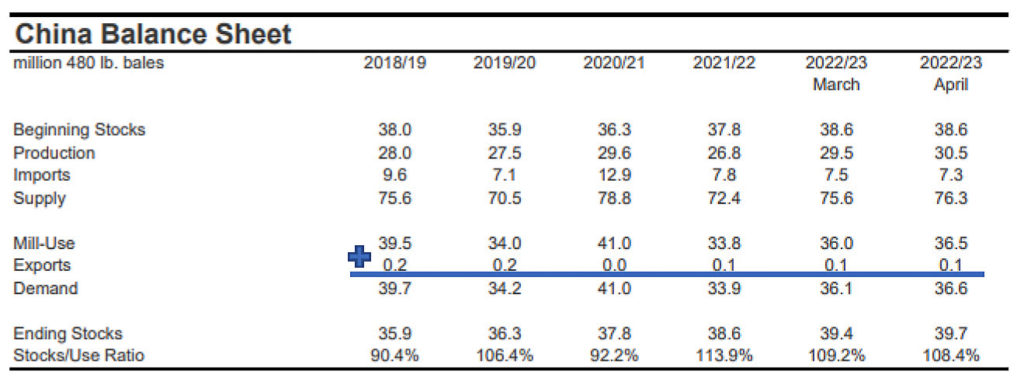
The amount of cotton spun into yarn or otherwise processed by mills into goods like non-wovens is called mill-use or consumption.
Cotton demand is equal to mill-use plus cotton exports. As with imports, exports are excluded from global calculations.
Mill-Use = Consumption = Cotton spun into yarn or transformed into other goods
Exports = Cotton shipped out of the country
Demand = Mill-Use + Exports
Ending Stocks
Ending stocks bring our balance sheet calculations full circle and are the difference between supply and demand.
Ending Stocks = Supply – Demand
Stocks-to-Use Ratio
Another statistic presented in balance sheets is the stocks-to-use ratio.
The stocks-to-use ratio is a misnomer because it is defined as ending stocks divided by demand rather than mill-use.
For interpretation, a ratio of 50% would indicate that half of a crop year’s demand could be met with available ending stocks. This measure of supply and demand has traditionally been correlated with cotton prices, but deviance from this relationship can occur.
High stocks-to-use ratios are traditionally associated with lower cotton prices.
Low stocks-to-use ratios are traditionally associated with higher cotton prices.
Stocks-to-Use Ratio = Ending Stocks / Demand
World-less-China
In the past, the Chinese government has held a large proportion of global cotton stocks. These reserves were not freely available to Chinese mills or for international trade. For that reason (and to simply examine supply and demand outside of China), it has become common to look at cotton supply and demand for the World-less-China.
Many entries for the world-less-China balance sheet are straightforward and are simply global volumes minus Chinese volumes.
World-Less-China Beginning Stocks = World Beginning Stocks – Chinese Beg. Stocks
World-Less-China Production = World Production – Chinese Production
World-Less-China Mill-Use = World Mill-Use – Chinese Mill-Use
World-Less-China Ending Stocks = World Ending Stocks – Chinese Ending Stocks
Trade is slightly more complex, where imports and exports reflect trade to and from China. World-less-China Exports are Chinese imports. World-less-China Imports are exports sent out of China.
World-Less-China Imports = Chinese Exports
World-Less-China Exports = Chinese Imports
For World-less-China Stocks-to-Use, different organizations have adopted different formulas. Cotton Incorporated’s calculations are consistent with country-level stocks-to-use equations, which are the ratio of ending stocks over demand (mill-use + exports). Some other organizations define stocks-to-use as world-less-China ending stocks over world-less-China mill-use (excluding exports to China). The specification used for World-less-China stocks-to-use in the Monthly Economic Letter appears below.
World-less-China Ending Stocks / World-less-China Demand
where
World-less-China Demand = World-less-China Mill-Use + Chinese Imports