Thirty years ago, Seinfeld was the number one TV show, the disheveled grunge look was all the rage, “Casual Fridays” were ushering in a more relaxed workwear environment – and Cotton Incorporated’s Lifestyle Monitor™ Survey began.
So much has changed since 1994 (hello, online shopping!), yet much has stayed the same (consumers still love to shop for clothes). And through it all, the Lifestyle Monitor™ has measured consumer attitudes and habits relating to fashion, shopping (even shopping during the pandemic!), the environment and other topics of interest.
It’s crucial to ensure that the survey addresses key attitudes and behaviors, particularly in relation to cotton goods, technology, and future directions.
Kim Kitchings, Senior Vice President, Consumer Marketing, Cotton Incorporated
The results of the survey are shared with brands, retailers, the textile/apparel supply chain, as well as the media. The Lifestyle Monitor™ is meant to serve as a tool for the industry, allowing brands and makers to better understand consumers and what they want, so product offerings can be honed to those preferences.
Ric Hendee, Cotton Incorporated’s former senior vice-president, consumer marketing, explains how the Lifestyle Monitor™ came into being back in the early-Nineties.
“Around that time, I read an article in Esquire magazine that I thought was very perceptive,” Hendee recalls. “They ran an interview with young men and women, asking them a series of questions about their politics, their consumption habits, their attitudes toward each other in school. But the questions were all done with humor. It was like having a conversation with somebody you wanted to talk to.”
“It was extremely insightful to learn what the 20-somethings of the early 1990s were thinking and feeling. And I thought it was a really astute way to do research,” Hendee says, so much so that he started talking to Cotton Incorporated’s J. Berrye Worsham, president and CEO, about doing something similar since, “we were always looking for new vehicles to generate publicity for cotton. And that’s where the concept of ‘why we wear what we wear and why we buy what we buy’ came from.”
So, what are some things that have changed over the years? Well, back in 1994, less than half of all consumers (47 percent) said they love and enjoy shopping for clothes. That’s jumped to 65 percent as of May 2024, according to Cotton Incorporated’s Lifestyle Monitor™ Survey. The increase could likely be attributed to more men’s wear options, the ability to easily shop online as well as the influence of the ever-present social media influencers.
While this appreciation for clothes shopping sounds great, clothing is no longer the top item of choice to shop for by U.S. consumers. It has been replaced by… wait for it… groceries. Consumer preference for grocery shopping increased from 22 percent back in 1994 to 36 percent today. A bright spot: The younger the consumer, the higher their interest in shopping for clothes, as Gen Z comes in at 36 percent compared to Boomers at 21 percent.
Cotton Incorporated’s Kim Kitchings, senior vice president, consumer marketing, says the Monitor™ Survey has been reflective of the population and a good indicator of behavior. And, she says, it’s always been relevant.
“The team was tasked with staying current, and I’m incredibly proud of their work over the past 30 years to keep the survey relevant,” Kitchings says. “Our focus has been on embedding the data and getting it to the decision makers. We’ve been very objective, providing not just the data but also practical examples of its implications and applications. As consumer behaviors evolve, we’ve continually asked, ‘How should the textile industry adapt?’ It’s crucial to ensure that the survey addresses key attitudes and behaviors, particularly in relation to cotton goods, technology, and future directions.”
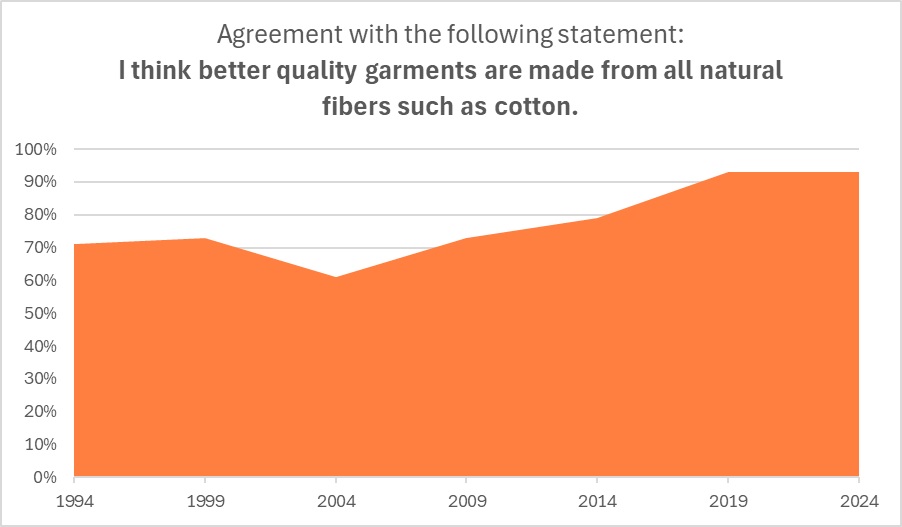
To that end, there has been a decidedly significant increase in how consumers feel about natural fibers. Back in 1994, 71 percent of consumers agreed with the statement that better quality garments are made from all-natural fibers such as cotton, according to the Monitor™ research. But as of 2024, that figure has leapt to 93 percent.
This preference for natural fibers and quality bears out in what consumers are willing to spend. The Monitor™ research shows that, despite some dips over the years, the majority of consumers are still willing to pay more for better quality. In 1994, 62 percent of consumers said they would pay more for better quality clothing. But around the recession years of 2008 and 2009, and with the growing popularity of low-priced fast fashion starting in the early- to mid-2000s, consumers said they were willing to sacrifice a little quality to get a good price. But after 2019, the trend switched again, so that as of May 2024, the majority (56 percent) say they are willing to pay more for better quality in their apparel.
Another change over the years has been why consumers go shopping for new clothes to begin with. Here, it seems the impact of social media, influencers, and video tutorials on how to style an outfit is likely having an effect. In 1994, half of all shoppers (50 percent) said they typically bought new clothes to replace their current styles while the other 50 percent said they were looking to buy something new, according to the Monitor™ data. These days, 64 percent of consumers say they’re looking for something new and different when clothes shopping, while just 36 percent are looking to replace what they already own.
The ability to track such preferences has always been a part of the Monitor™ Survey’s DNA.
“We created barometers,” Hendee says. “A denim barometer, fiber consciousness and preferences, shopping preferences. We gave the media a lot of statistics and facts they otherwise couldn’t have quoted. They might have known consumers felt this way or that, but now they had something they could quote from a reliable source.”
Even sources of clothing ideas are covered in the Monitor™ Survey – and that’s one area where things have both changed dramatically and stayed the same. For instance, the majority of consumers (63 percent) say they get their clothing ideas from what they already own and like. That’s virtually unchanged from 1994 when 62 percent of consumers said as much. However, clothing ideas from store displays/window shopping has dropped from 53 percent in 1994 to 28 percent in 2024. The influence from fashion magazines (24 percent in 1994 to 17 percent as of May of 2024) and commercials (29 percent in 1994 to 17 percent as of May of 2024) have also dropped significantly in sources of clothing ideas for consumers over the years. But an area that saw significant increase? Social media platforms. Consumers cite places like Instagram and TikTok as sources (32 percent) even though social media wasn’t added as a survey option until 2021.
Such insights, as Kitchings points out, are extremely valuable to the industry.
“Businesses are leveraging the Monitor™ survey not only for current consumer insights but also to guide future strategies,” Kitchings says. “Consumers often struggle to express their needs, but by analyzing the data and combining with other macro trends, we can identify future opportunities and determine our next steps.”