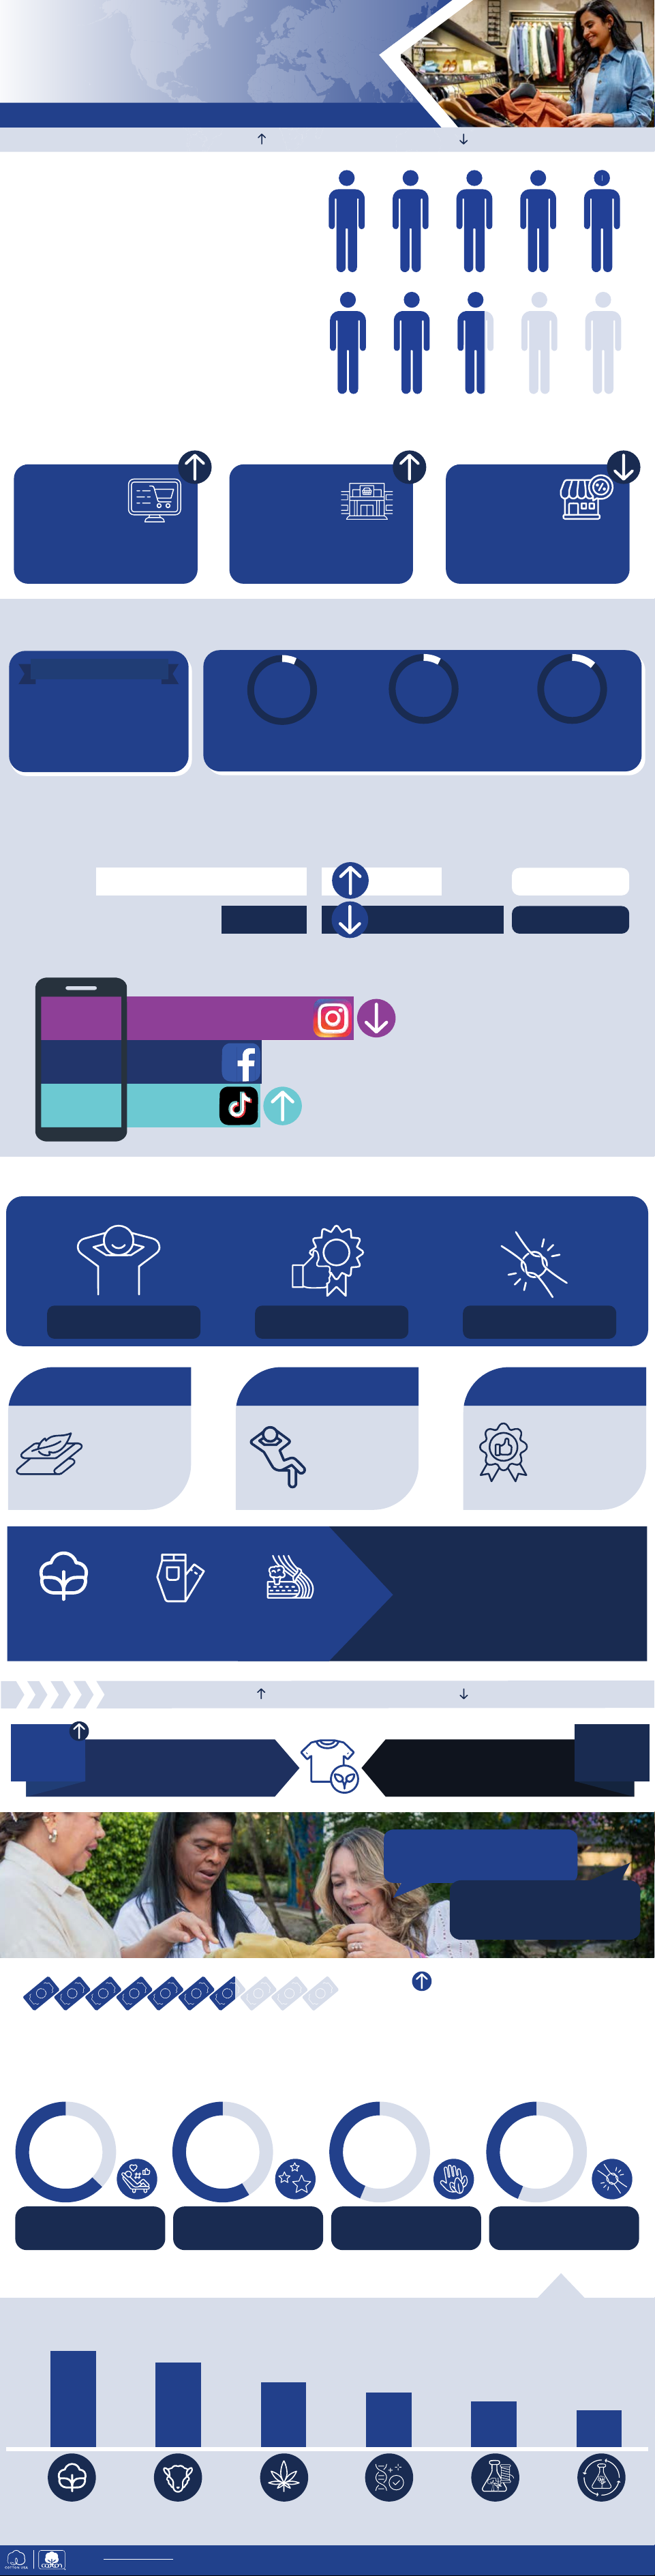
Supply Chain Insights – Consumer Insights in Colombia
October 15, 2025
Comfort DurabilityQuality
Drivers of Consumer Prefrence
*Tencel is a trademark of Lenzing
SUSTAINABILITY
= significantly higher in 2025 = significantly lower in 2025
Top Retailers Shopped for Clothing
Top Ways Plan to Shop for Clothing in Next Year
Cotton Preference
Top Reasons Would Pay More for Clothes Made from
Natural Fibers
Preferred Shopping Method
Top Social Media Sources
% Say Is Safe for the Environment (Top 5 of 11)
AMERICA’S COTTON PRODUCERS AND IMPORTERS Service Marks/Trademarks of Cotton Incorporated ©2025 Cotton Incorporated
Source: Cotton Council International and Cotton Incorporated’s Global Lifestyle Monitor™ survey, conducted with n=1,003 consumers in Colombia
COTTONINC.COM
LIFESTYLEMONITOR.COTTONINC.COM
77%
Feel very/somewhat
optimistic about their
financial situation
30% 47%
Changing how shopping
for clothing to reduce
environmental impact
Rely on a sustainability
certification or seal to determine
if clothing is made in an
environmentally friendly manner
67%
Willing to pay more for natural
fibers such as cotton
Sustainability
is nice to
have
47%
Only purchase
sustainable
clothing
18 %
75%
66%
43%
51%
36%
29%
Cotton Wool Hemp Polyester Rayon Tencel*
Cotton
blends
Denim
Cotton
Prefer Cotton, Cotton
blends, or Denim
82%
90% 87%
93%
I will do more
research so I can
get the best value
I will buy
higher-quality,
longer-lasting items
I will buy more
comfortable
clothing
I will buy some new
clothing, but less than usual
Top Way Plan to Shop
57%
69%
Discount store
(In-Store)
78%
Online only store
75%
Mass merchant
(In-Store)
65% 60% 40% 38%
More durableMore comfortable Better quality
Hypoallergenic/less
irritating to skin
&UHDWHG
E\
5DKPDW
6LJLW
3UDVHW\R
IURP
1RXQ
3URMHFW
Soft Comfortable High Quality
79%81% 66%
GLOBAL LIFESTYLE MONITOR: INDIA
GLOBAL CONSUMER
INSIGHTS
IN COLOMBIA
SHOPPING TRENDS
= significantly higher in 2025 = significantly lower in 2025
78%
60%
59%
TIKTOK
FACEBOOK
INSTAGRAM
Use social media
as a top source of
inspiration
(social media/blogs/vlogs)
52%
65%
70%
In-Store
Online
28%
34%
Browsing
Purchasing