Market forces inside and outside of China that have kept cotton prices higher in recent years are disappearing. As a result, cotton prices around the world have moved lower. The principal drivers of price decreases include Chinese cotton policy reforms and expectations for large harvests outside of China. Increases in available cotton stocks should continue to place downward pressure on cotton prices. With the transition to lower cotton prices, questions have emerged regarding how much and when lower fiber prices may translate into lower sourcing costs for fabrics and garments.
ESTIMATING THE MAGNITUDE OF DECLINE
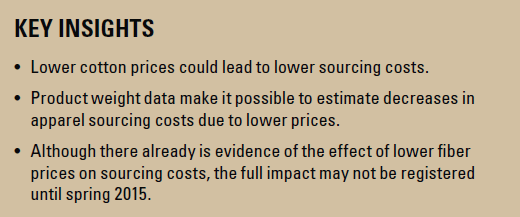
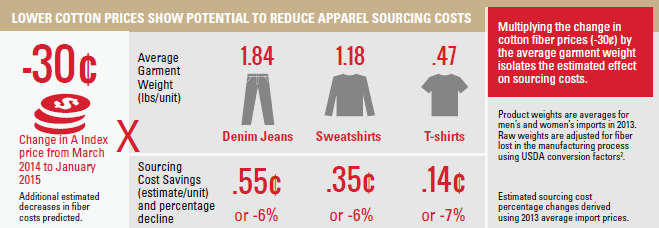
Estimating the impact of lower cotton prices on sourcing costs yields useful information for understanding and managing apparel production costs. Analytical approaches developed and implemented by Cotton Incorporated to forecast increases in sourcing costs following the cotton price spike in 2010/11 can also be used to provide insight about future sourcing costs decreases. One approach, based on the fact that cotton garments are primarily composed of cotton fiber, utilizes garment weights. Publicly available data1 describing the count, weight, and value of apparel imports can be used to produce weight-based estimates of the effect of lower cotton prices. Multiplying a garment’s average weight by the change in cotton prices quantified in cents/lb produces a calculated per unit benefit from price decreases. These data suggest that the decrease in per unit costs could be larger for heavier goods, like denim jeans.
Calculated sourcing cost savings figures show the estimated effects due to fiber price changes alone. To provide additional context regarding the magnitude of the effect of lower fiber prices, estimated effects are also presented in percentage terms. The percentage changes were derived as the relative difference between average import prices in 2013 and the estimated change in sourcing costs based on average product weights. Results from this analysis indicates that sourcing costs could decrease by 6% to 7%. In reality, upward pressure on costs from rising wages and other non-fiber costs like dyestuffs may partially offset decreases in sourcing costs made possible by lower cotton prices.
TIMING OF DOWNSTREAM DECREASES
Cotton Incorporated continually tracks prices throughout the cotton supply chain in ongoing pass-through analysis and research that includes the relative timing of changes in prices at different textile manufacturing stages. Over the last ten years, there have been three instances when cotton prices declined more than 20 cents/lb within a six month period: following the financial crisis during the fall of 2009, after the wake of the 2010/11 price spike, and between the spring and fall of 2014. Average prices for cotton-dominant imports dropped after each of these periods when cotton prices decreased significantly.
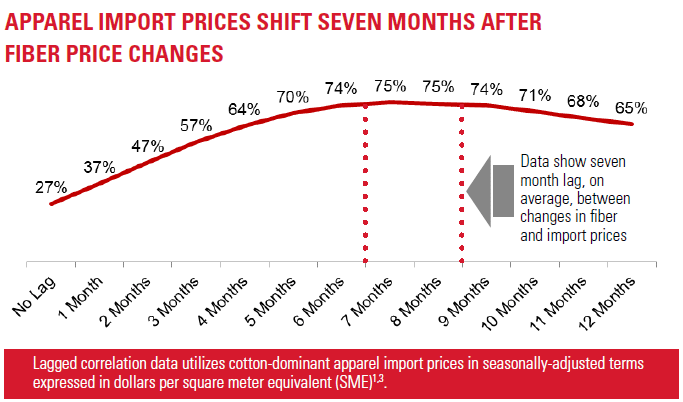
Examination of data about the relationship between fiber prices and cotton-dominant import prices reveals that the strongest statistical relationship between fiber prices and apparel import prices is seven months. Given a seven month lag between shifts in fiber prices and apparel import prices, analysis suggests that cotton import shipments arriving in late spring/summer 2015 should fully incorporate the effects of recent decreases in fiber prices.
MAINTAINING LOWER COTTON PRICES
Changes in China’s cotton policies have paved the way for the full decrease in prices that could have been expected with the massive accumulation of global stocks that followed the 2010/11 spike in prices. Current estimates suggest that China holds more than 60% of global warehoused supply and that Chinese cotton stocks are nearly six times larger than before the establishment of the government’s price guarantee policy. Due to reforms in Chinese government cotton policies, the reserve system will no longer function as such a dominant force of demand. Going forward, the world market can view China’s reserve system as a source of supply since it will no longer be making purchases and could be expected to sell eventually from its accumulated supplies.
Increases in projected forecasts for the cotton harvest in other major cotton producing countries, notably India and the U.S., may further impact cotton prices. The current forecast indicate that India’s production will match its own record of 31.0 million bales in 2014/15 and that the country will surpass China as the world’s largest cotton grower–a title that China has held since the 1980s. Improved rainfall conditions in cotton growing regions within the U.S., specifically West Texas, have led to higher production forecasts and expectations that have helped push NY Futures and A Index cotton prices lower. Higher production forecasts in exporting countries like the U.S. and India imply that more cotton supply will be available to the world market at lower prices.
BENEFITING FROM GLOBAL SURPLUS
World supply and demand conditions should make the reality of lower cotton prices more likely than higher prices in coming years. Increased availability of Chinese cotton stocks, resulting from reforms to the Chinese reserve program, should hold prices at lower levels. Additionally, lower prices for corn and soybeans, which can compete with cotton for farm acreage, suggest a diminished threat of farmers planting less cotton in future crop years. Even with stronger than average growth in demand for cotton, the current global surplus should last for several years. Stakeholders throughout the cotton supply chain may benefit from lower prices and the unprecedented amount of supply available for the production of apparel, home textile, and non-woven products.
About the Research
Cotton Incorporated provides ongoing intelligence on the cotton market and other important economic indicators through the publication of the Monthly Economic Letter and Executive Cotton Update. External data sources: U.S. Chamber of Commerce1, USDA2, and Cotlook (A Index)3.


